Facts & figures
The following facts and figures result from the partnership with NielsenIQ (Switzerland) and reflect the entire Swiss detergents and cleaning products market. The figures are based on scanning data from the Nielsen Retail Trade and Prestige Panel.
| Sales in CHF mn | 2021 | 2022 | 2023 |
| (Consumer prices) | CHF | CHF | CHF |
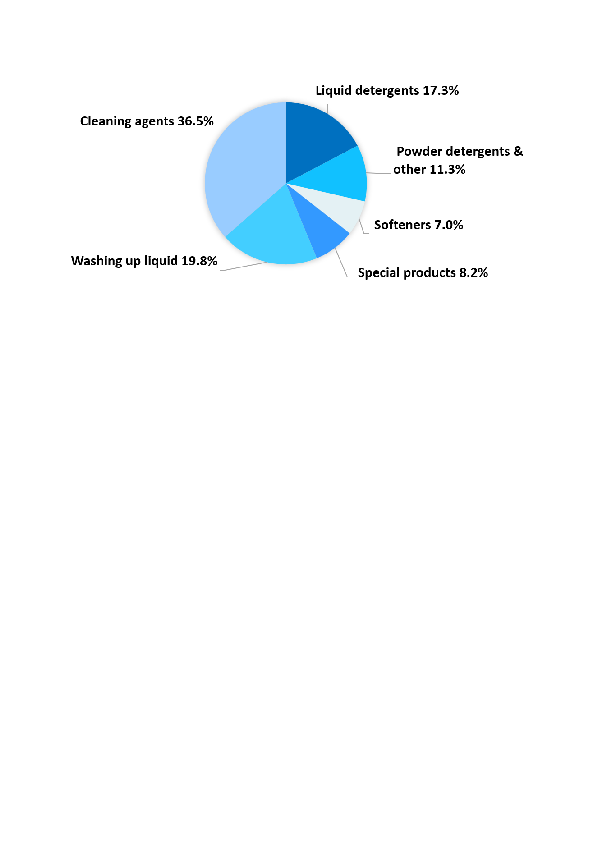
| Liquid detergents | 127.9 | 119.4 | 123.3 |
| Powder detergents & other | 72.6 | 74.1 | 80.5 |
| Softeners | 46.7 | 45.6 | 49.7 |
| Special products | 63.2 | 60.0 | 58.5 |
| Washing up liquid | 155.7 | 139.6 | 140.8 |
| Cleaning agents | 279.0 | 257.7 | 260.1 |
| Total | 745.1 | 696.4 | 712.9 |
Share of market sectors 20223